Eliminate Blind Spots in Shaft Inspection with 3D Mapping
Will Smith – Director of Software, Adcole LLC
Over the last several years, manufacturing requirements for precision components have tightened at an unprecedented pace. Engineering tolerances that were once considered exceptional are now standard expectations. As these tolerances continue to shrink, the demand for highly controlled manufacturing processes and equally precise verification methods has grown just as rapidly. In particular, qualifying complex rotary components such as crankshafts, camshafts, and other rotational geometry has become increasingly challenging as the margins for error approach single‑micron levels, which requires a measurement down to one-tenth of that margin.
To meet these evolving expectations, manufacturers rely on advanced precision‑measurement technologies and robust inspection workflows. These tools help ensure that each part meets its dimensional specifications at key measurement locations. However, even with sophisticated gauging, there remains a fundamental limitation: traditional inspection methods often capture only a narrow view of the part. Critical geometric behavior can exist between standard measurement positions, and without deeper analysis, these subtle variations may remain undetected.
This is where enhanced rotary‑part analysis becomes invaluable. By augmenting standard qualification techniques with tools capable of capturing a more complete picture of a component’s form across its full rotation and full surface, manufacturers can gain a clearer understanding of how the part behaves in real operating conditions. Such insight not only confirms that the manufacturing process is performing as intended but also identifies issues that conventional inspection methods may overlook.
As tolerances tighten and component complexity continues to rise, integrating deeper analytical capabilities is no longer optional but is an essential for ensuring part quality, process stability, and long‑term manufacturing efficiency. This article will focus on the limitations of standard low data density measurement and how 3D Color Map Analysis can provide the necessary data to keep up with today’s manufacturing requirements.
Standard Part Qualification Limitations
While standard part‑qualification routines capture a large number of measurements and evaluate numerous parameters against engineering tolerances, they still provide only a partial view of the machined component. Even extensive dimensional datasets can fall short when it comes to revealing the true geometric behavior of individual features. For rotary components such as journals, pins, and other critical features, this limitation becomes even more pronounced.
3-Trace Measurement
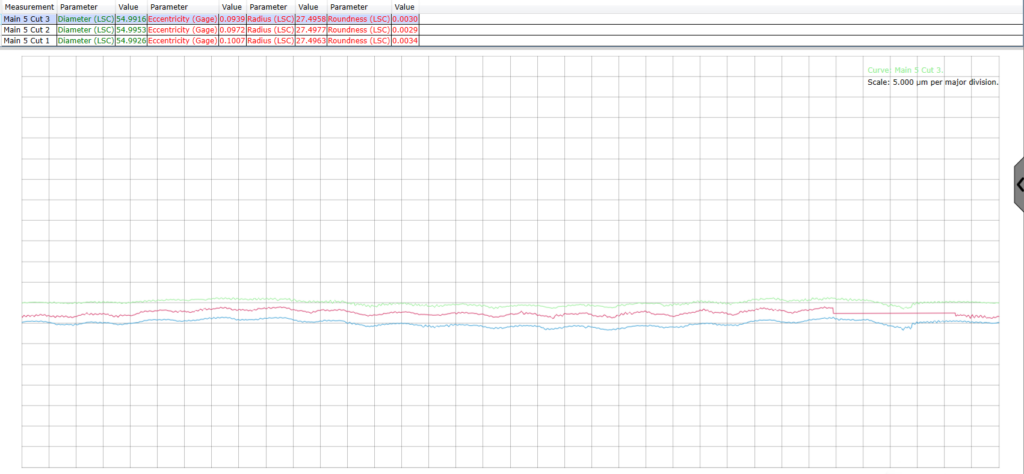
Many qualification processes rely on a small number of radial traces per element, often three, to generate roundness plots and calculate multi‑cut parameters such as taper, barreling, or center deviation. These metrics are valuable and widely used, but the measurement strategy itself constrains the insight that can be gained. With only three circumferential sampling locations, the analysis provides a snapshot of the part’s characteristics rather than a continuous, detailed representation of its actual form.
Even with multiple radial traces, the data remains inherently sparse. The spacing between the radial cuts creates large sections of each element’s surface that go unmeasured. As a result, subtle form variations such as localized waviness, minor lobing forms, chatter marks, tooling vibrations, burnishing artifacts, or other micron surface occurrences may never be captured. These smaller defects can impact part performance, yet remain entirely invisible within the constraints of standard inspection process.
Additionally, this measurement approach does not allow engineers to evaluate how an element’s surface interacts with or behaves relative to adjacent elements. For components such as crankshafts, where journals and pins must operate in highly coordinated motion and maintain precise alignments, understanding this inter‑element relationship is critical. Traditional qualification can verify each element individually, but it cannot reveal form deviations that propagate or correlate across multiple features.
In short, the limited number of radial cuts and the significant linear distance between them create blind spots in the measurement data. These blind spots may conceal meaningful variations that could influence engine efficiency, bearing performance, oil‑film behavior, or long‑term durability.
Solution
A simple, easy‑to‑use tool that generates a detailed 3D map of the entire shaft can reveal manufacturing issues that standard 2D qualification plots and parameters cannot. While traditional measurements offer useful snapshots of size, roundness, and runout, they provide only limited visibility into the true form of each element.
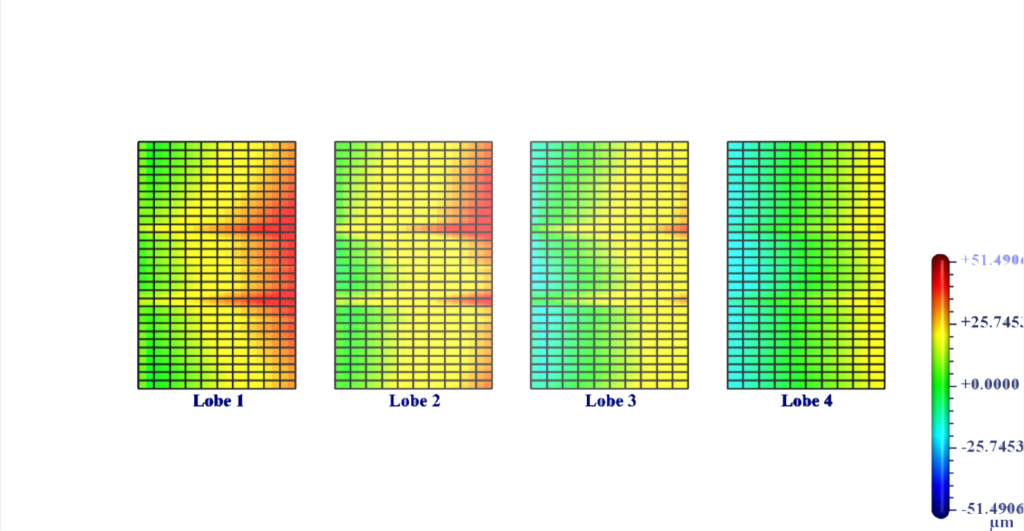
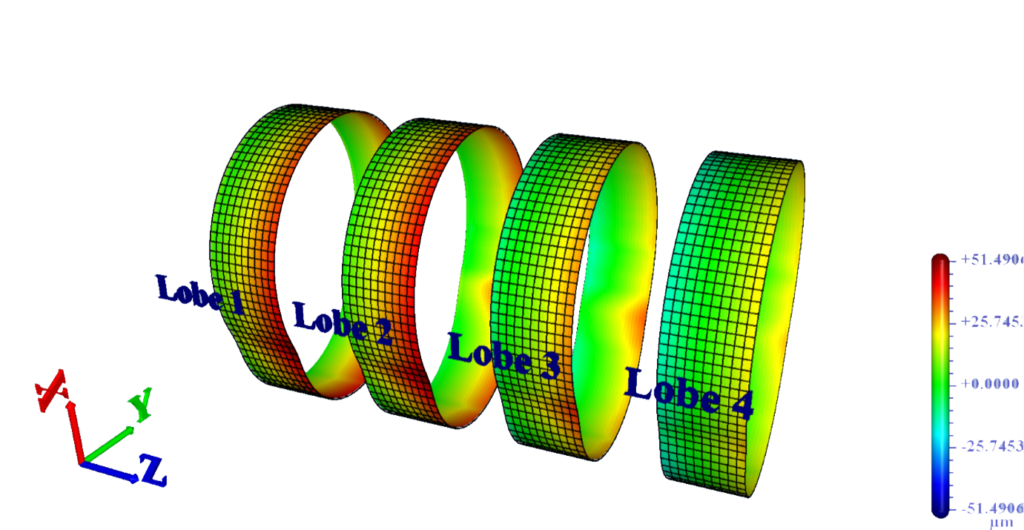
By capturing numerous radial traces around each feature and converting the data into color‑coded topographical plots engineers gain a much clearer understanding of surface behavior. For example, a 3D Color Map can show profile changes that indicate a twist in a cam lobe, something standard averages and taper calculations would not detect because the variations occur at different angular positions as shown in the following image.
Improper grinding that is highlighted in 3D Color Map looking at a single lobe. This option shows the lobe form normalized to the average measured data.
The Adcole 3D Color Map program is an example of a tool designed specifically to overcome these limitations. After running a customized inspection routine where up to 24 radial traces can be taken on each component element, the system produces a dense 3D representation of the part. For crankshafts, this includes all mains, rod journals, and auxiliary mains; for camshafts, it includes journals, lobes, and auxiliary journals. Instead of relying on one to three roundness traces per element, engineers can now generate a full part map with detailed information derived from dozens of traces.
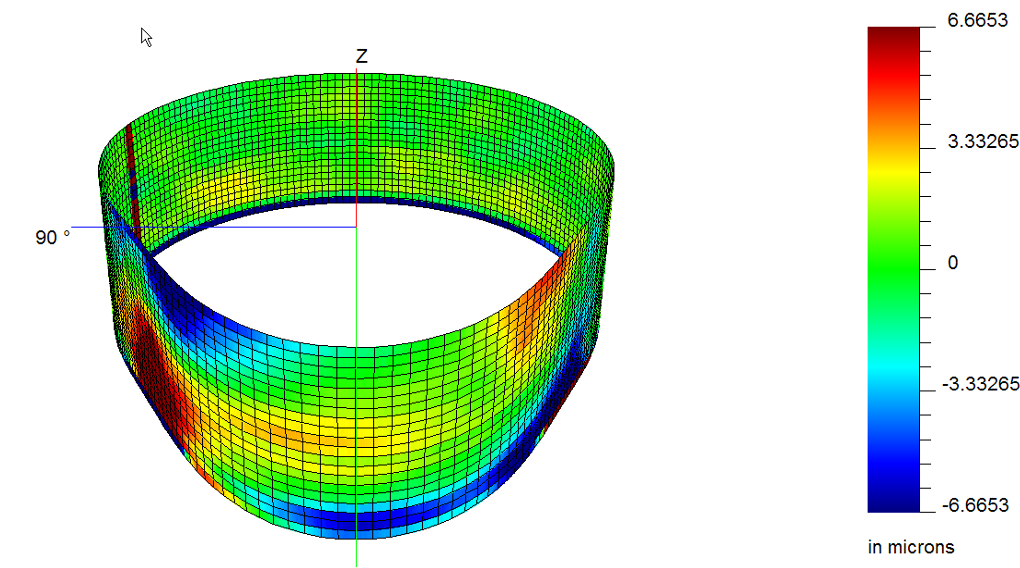
A 20-Trace 3D Mapping of a journal clearly shows form errors that standard methods might miss
This expanded dataset allows the user to select different display modes such as size, roundness, or runout on multiple selectable datums. The result is a high‑resolution visualization of each individual element and the ability to view the entire shaft from a range of perspectives. This level of detail provides meaningful insight into the behavior of the manufacturing process, enabling earlier detection of issues such as localized form deviations, surface anomalies, geometric distortions, or tooling‑related phenomena that traditional methods don’t appear in the results.
In summary, tools that provide true 3D mapping and visualization dramatically enhance the engineer’s ability to understand the real condition of rotary components. They not only reveal hidden defects but also support process optimization, product refinement, and higher‑confidence quality assurance. These capabilities that are becoming indispensable as tolerances continue to tighten and component complexity increases.
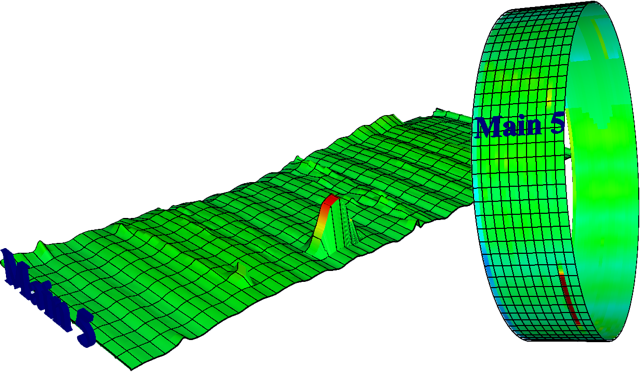
Ability to view multiple features together in 3D and 2D